Trust Dashboard
The Trust Dashboard at trust.truvant.ai provides fleet-wide visibility into your AI agent security posture — every host, every artifact, every alert, across your entire organization.
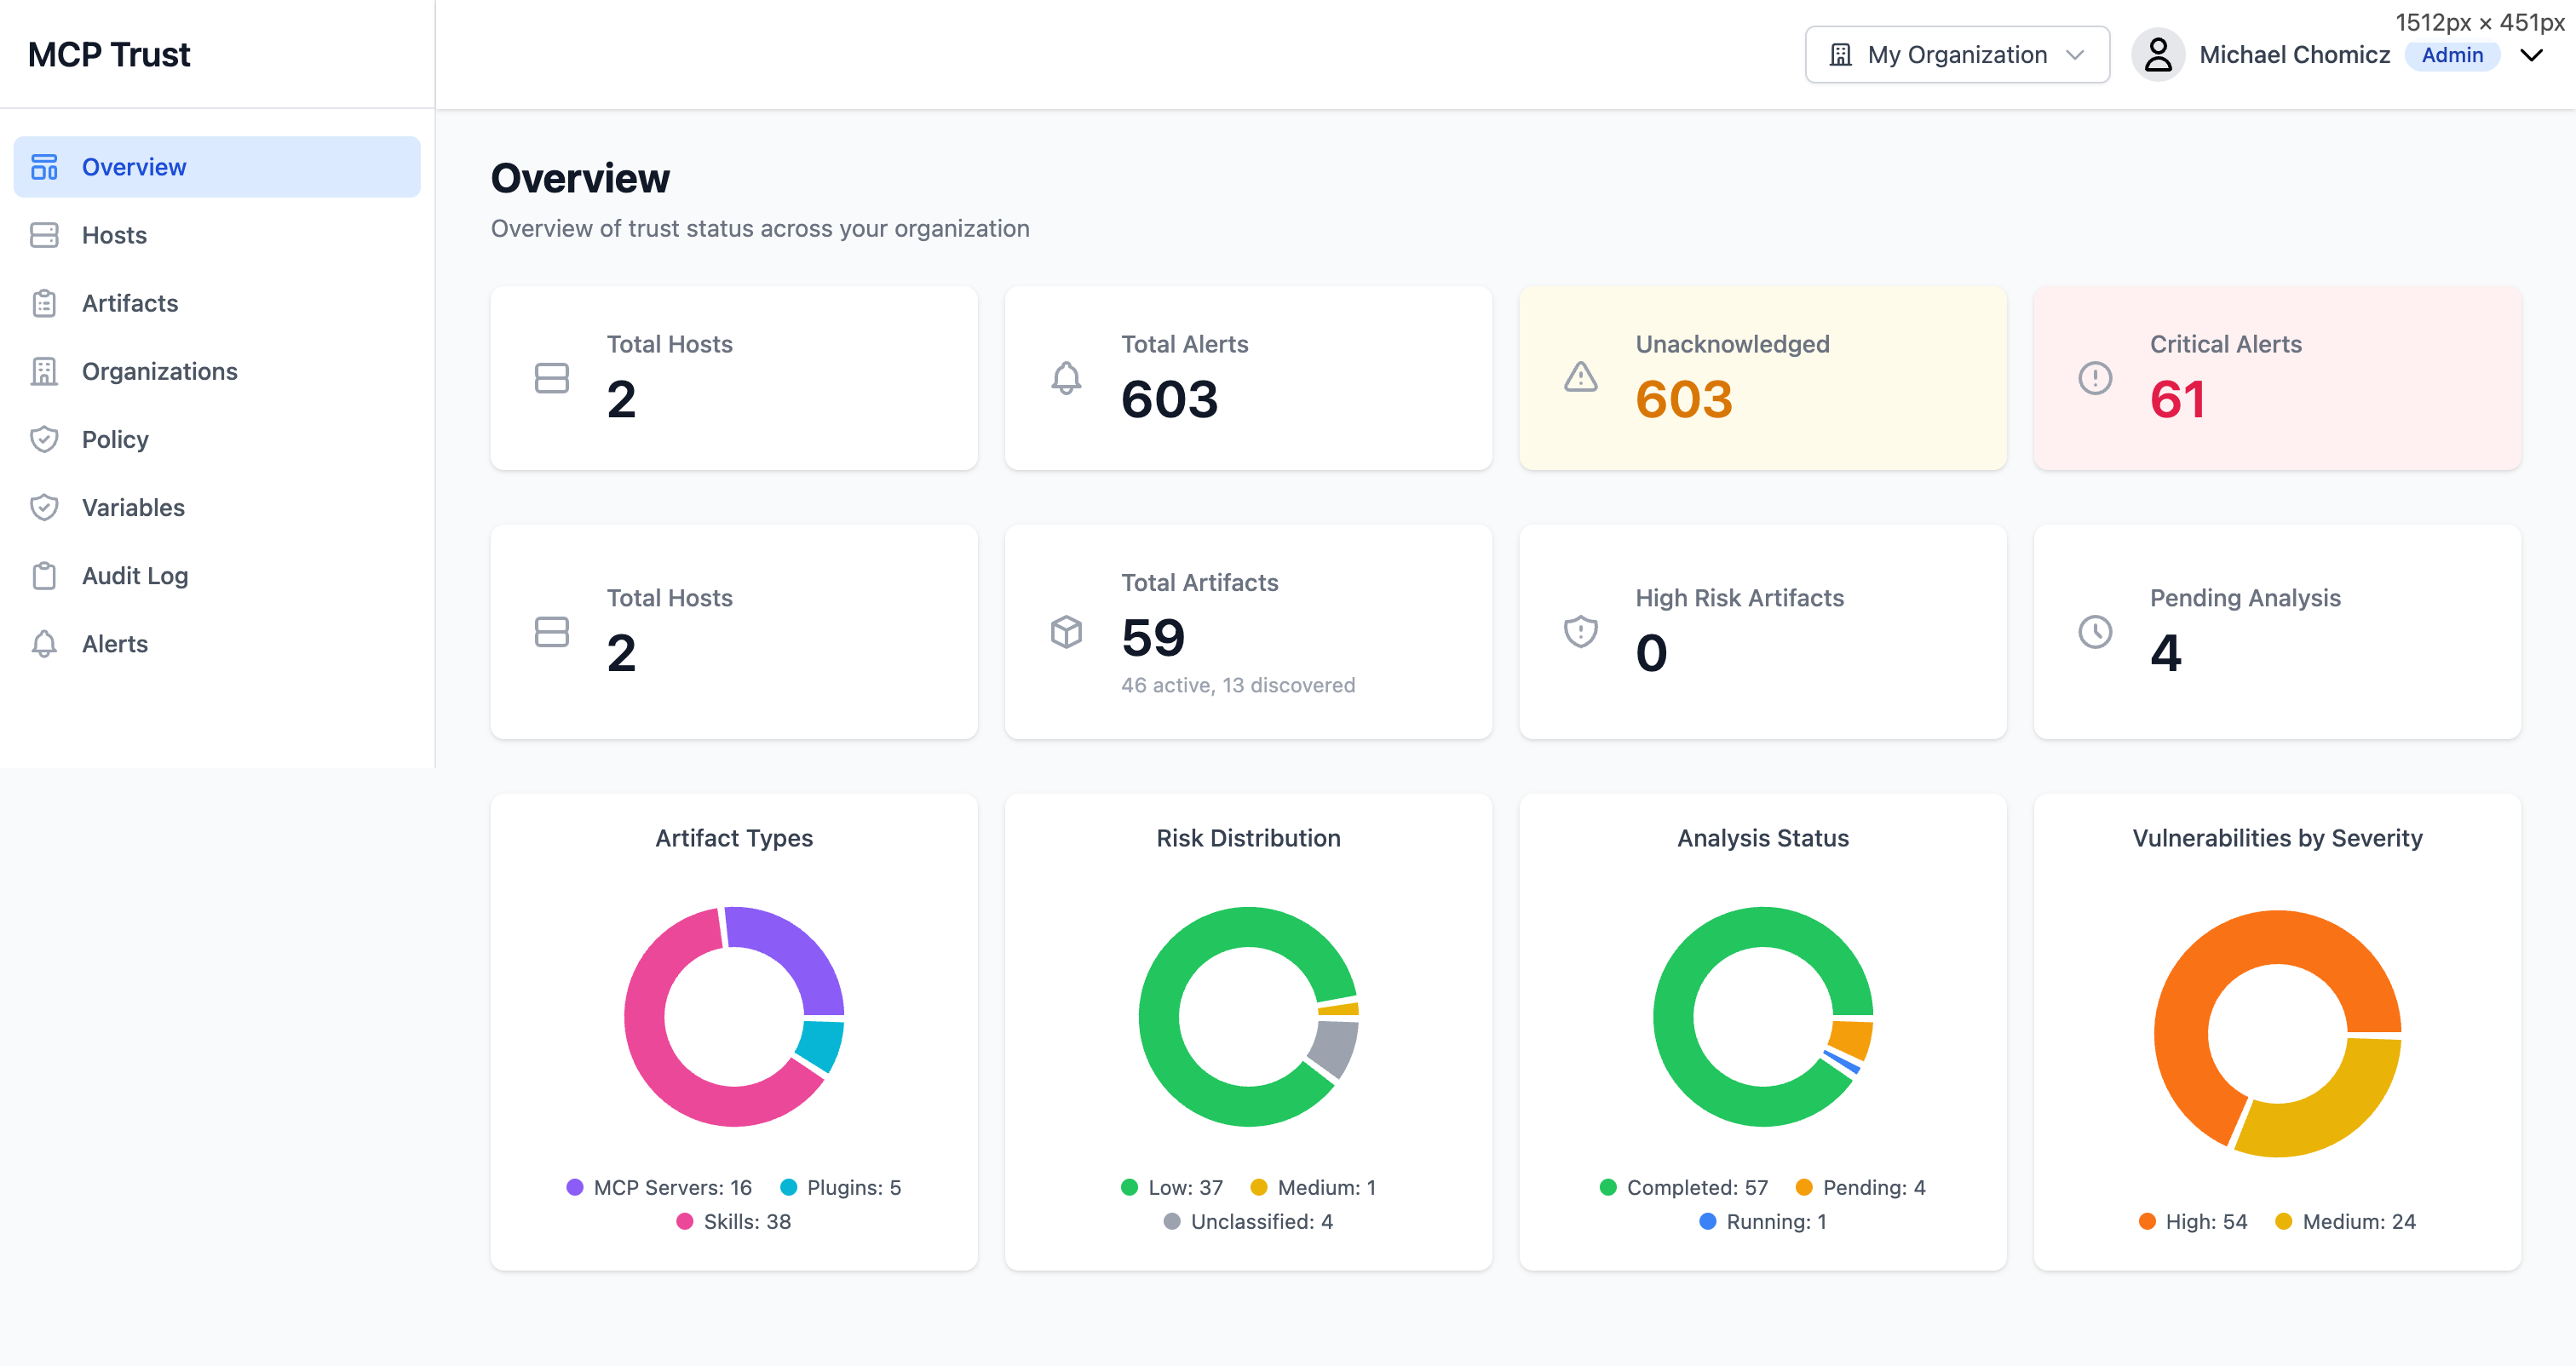
Overview
The Overview page surfaces your organization's current security posture at a glance. It is the first screen you see after logging in and is designed to surface actionable information immediately.
KPI Cards
- Total Hosts — All machines running the Truvant enforcement agent, regardless of health state.
- Total Alerts — All alerts generated across the fleet, including acknowledged and resolved.
- Unacknowledged Alerts — Alerts that have not yet been reviewed. This is the primary action queue for on-call teams.
- Critical Alerts — Alerts at critical severity. These require immediate attention and are highlighted prominently.
- Total Artifacts — All MCP server artifacts (npm packages, git repos, containers) discovered across the fleet.
- High Risk Artifacts — Artifacts with a high or critical risk rating from the scanner. Click to filter the artifact inventory.
- Pending Analysis — Artifacts that have been discovered but not yet scanned. Pending count drops as background analysis completes.
Donut Charts
- Artifact Types — Breakdown of discovered artifacts by type: npm, git, container, remote endpoint.
- Risk Distribution — Distribution of artifacts across risk levels: Critical, High, Medium, Low, Informational.
- Analysis Status — Proportion of artifacts that are Complete, Pending, or Failed analysis.
- Vulnerabilities by Severity — Aggregate CVE counts across the fleet, bucketed by CVSS severity band.
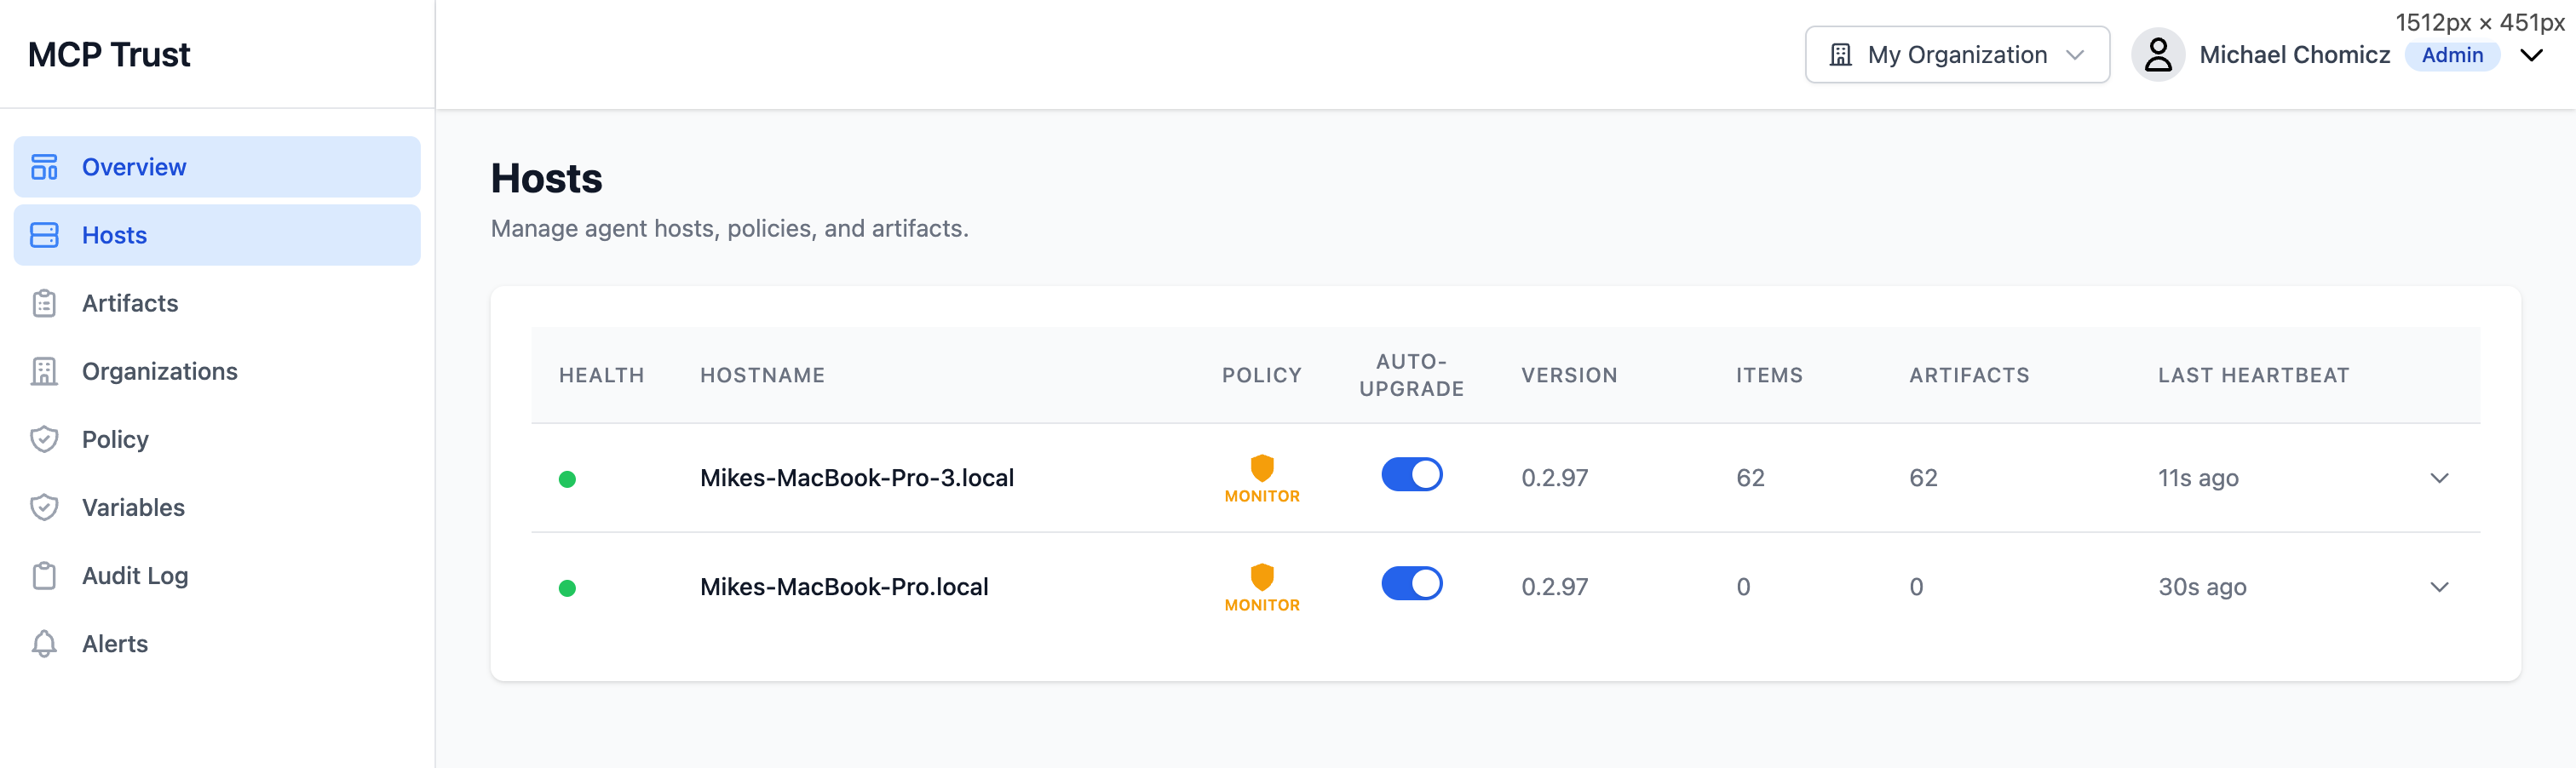
Hosts
The Hosts page lists every machine in your fleet running the Truvant enforcement agent. Each row represents one host and surfaces the information you need to assess its health and policy state without drilling in.
| Column | Description |
|---|---|
| Health | Overall health indicator: Healthy, Degraded, or Unreachable. Based on heartbeat recency and active alert count. |
| Hostname | The machine hostname as reported by the agent. Click to open the host detail view. |
| Policy | The policy role currently assigned to this host. Unassigned hosts inherit the organization default. |
| Auto-Upgrade | Whether the agent will automatically upgrade to new releases when available. |
| Version | The agent version running on this host. Outdated versions are flagged with a yellow indicator. |
| Items | Number of MCP configuration entries discovered on this host (e.g., entries in claude_desktop_config.json). |
| Artifacts | Number of unique artifacts resolved from the host's MCP config. One config entry may resolve to multiple artifacts (package + its dependencies). |
| Last Heartbeat | Timestamp of the most recent check-in from this host's agent. Hosts that have not checked in within the expected interval are flagged. |
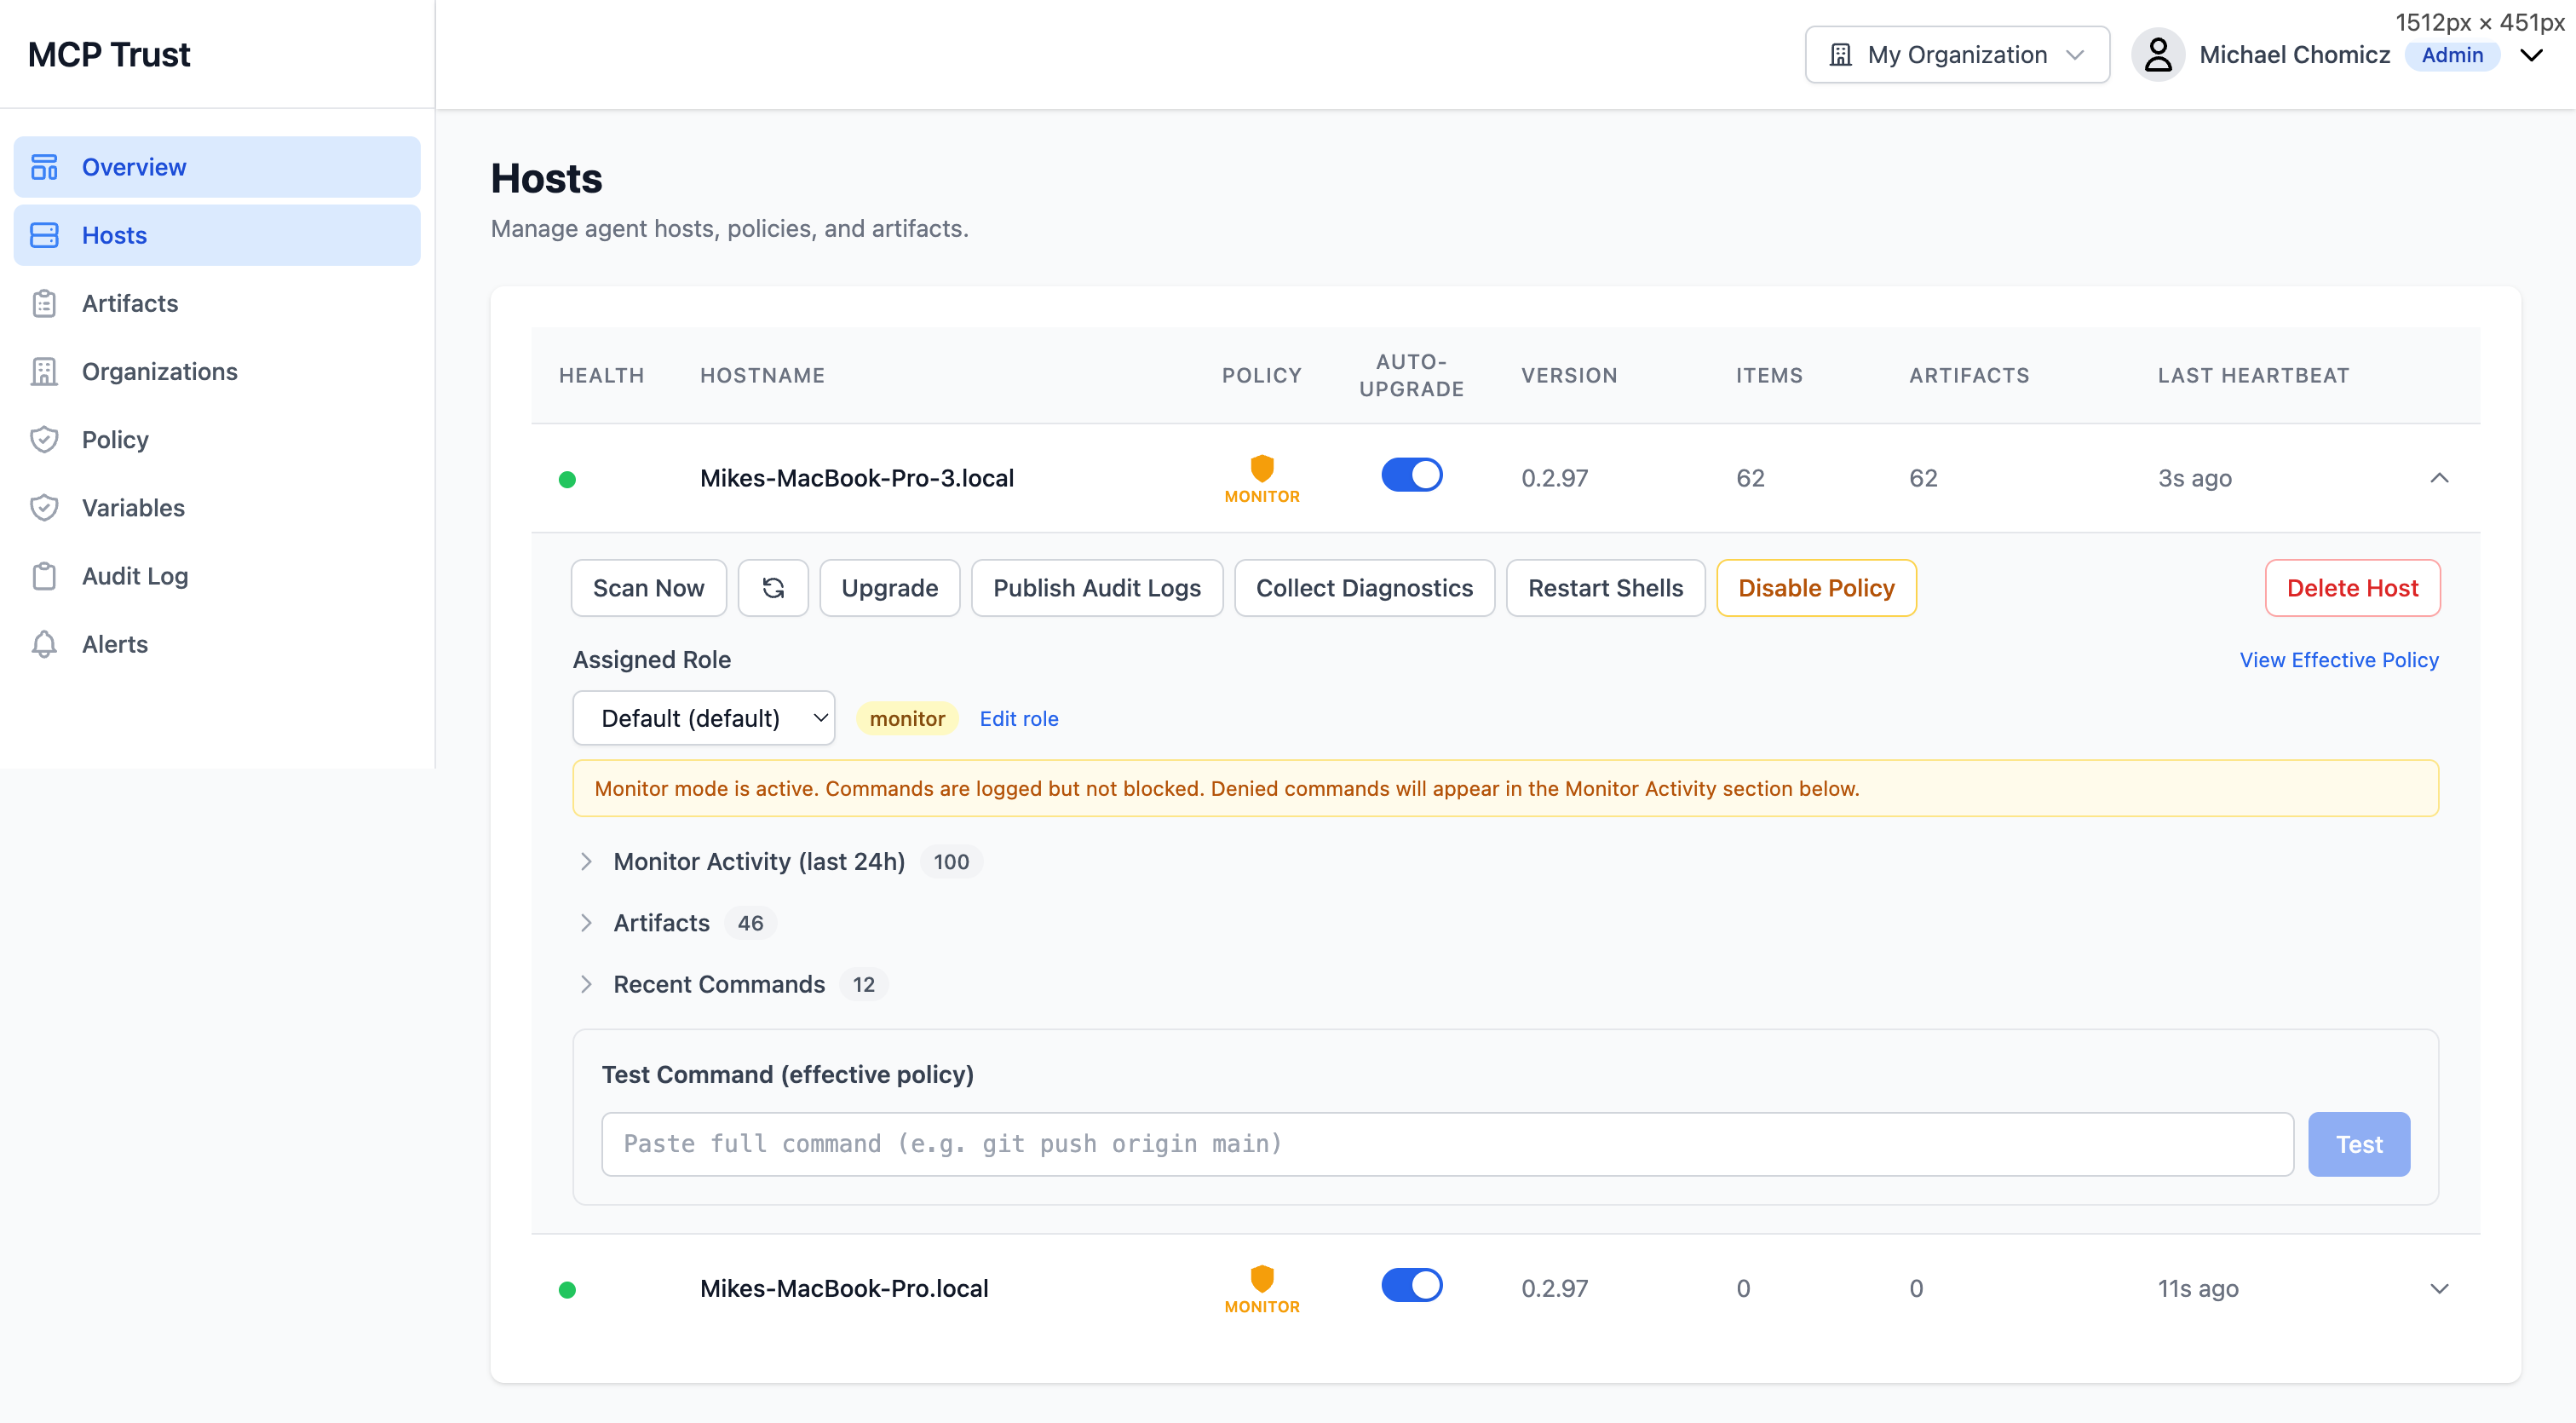
Host Detail
Click any host row to open the Host Detail view. This is the primary interface for managing an individual host, investigating its activity, and testing policy changes before applying them fleet-wide.
Actions
- Scan Now — Trigger an immediate artifact scan on this host rather than waiting for the next scheduled scan.
- Upgrade — Push an agent upgrade to this host on demand, regardless of the Auto-Upgrade setting.
- Publish Audit Logs — Force an immediate flush of buffered audit log events from this host to the backend.
- Collect Diagnostics — Bundle and upload a diagnostic archive (logs, config, agent state) to S3 for support or investigation. Returns a bundle ID you can share.
- Restart Shells — Send a signal to all active shell sessions on this host to reload the enforcement shim. Use this after a policy change if you do not want to wait for the automatic reload interval.
- Disable / Enable Policy — Temporarily suspend policy enforcement on this host without removing the agent. Useful when diagnosing an issue or testing a workflow that is being blocked unexpectedly.
Detail Sections
- Assigned Role — Shows the policy role currently in effect on this host, with a link to open the role in Policy Management.
- Monitor Activity (last 24h) — A time-bucketed view of all commands and MCP tool calls observed in the last 24 hours. Separate tracks for allowed, blocked, and would-have-been-blocked (Monitor mode) events.
- Artifacts — The full artifact inventory for this host, with risk ratings, scan status, and links to individual artifact detail pages.
- Recent Commands — A chronological log of the most recent commands executed by AI agents on this host, with their policy decisions.
- Test Command — An interactive input that lets you test arbitrary commands against the host's current policy without actually executing them. Returns the policy decision (allow/deny), the matching rule, and the reasoning.
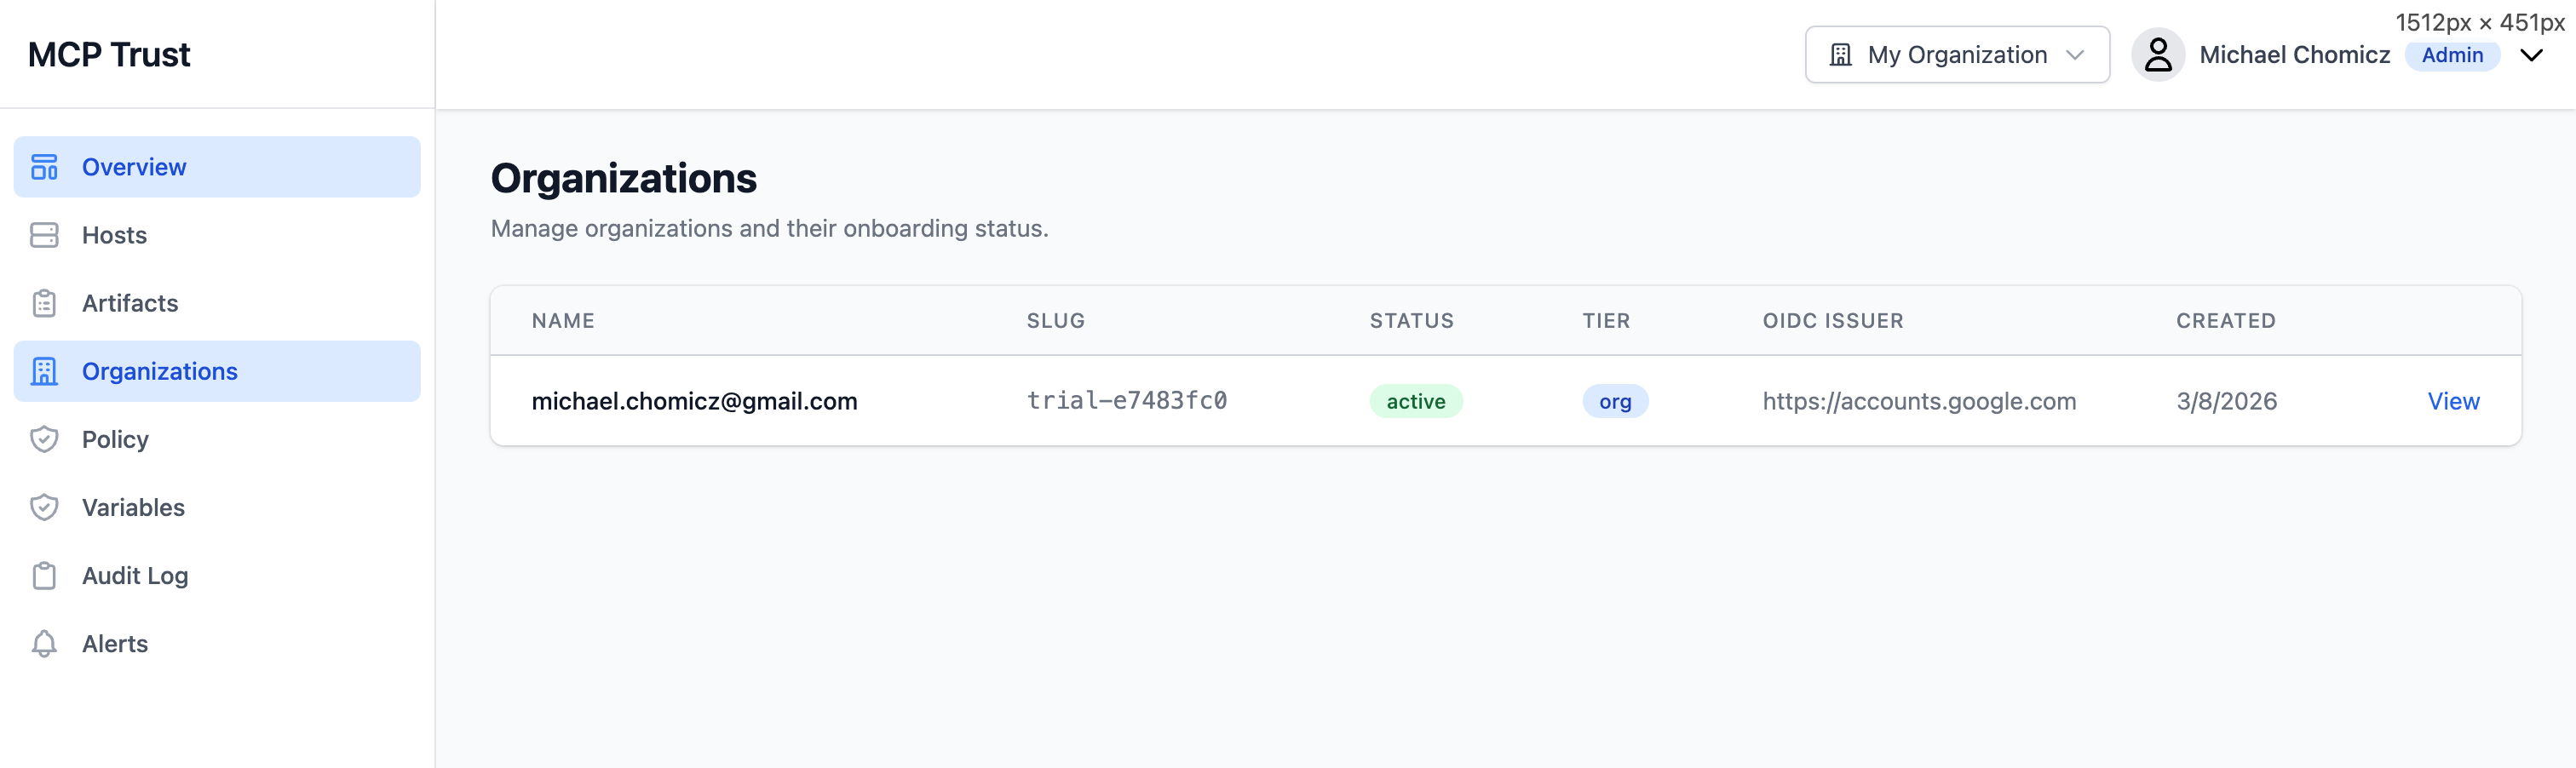
Organizations
The Organizations page lists all organizations your account has access to. Enterprise accounts can manage multiple organizations from a single login — use the org switcher in the top navigation to move between them without logging out.
| Column | Description |
|---|---|
| Name | Human-readable organization name, set during registration or editable by an admin. |
| Slug | URL-safe identifier used in API paths and agent registration tokens. |
| Status | Active organizations are fully operational. Trial organizations are within the free 30-day trial window. Suspended organizations have enforcement disabled pending billing action. |
| Tier | Subscription tier: Trial, Team, or Enterprise. Determines feature access, seat limits, and data retention windows. |
| OIDC Issuer | The configured identity provider issuer URL. Blank for organizations using Google or Microsoft social login. Set this to connect an enterprise OIDC provider (Okta, Auth0, Keycloak, Entra ID). |
| Created | Date the organization was registered. |
To switch organizations, click your organization name in the top navigation bar and select the target organization from the dropdown. All views — hosts, policies, alerts, and audit logs — are scoped to the active organization.